Free sheet music here: http://www.restored.faithweb.com/

Former CBS News president Richard Salant (1961 - 64 and 1966 - 79) explained the major media's role: "Our job is to give people not what they want, but what we decide they ought to have." ...and to this very day most Americans haven't noticed they're being brained washed! ~ N. Hooben
Friday, December 2, 2016
Wednesday, November 30, 2016
Says volumes about Amherst, Massachusetts...


Update May 8, 2018...Maybe those Amherst College folks should take lessons from the folks in Sheboygan, Wisconsin..
Tuesday, November 29, 2016
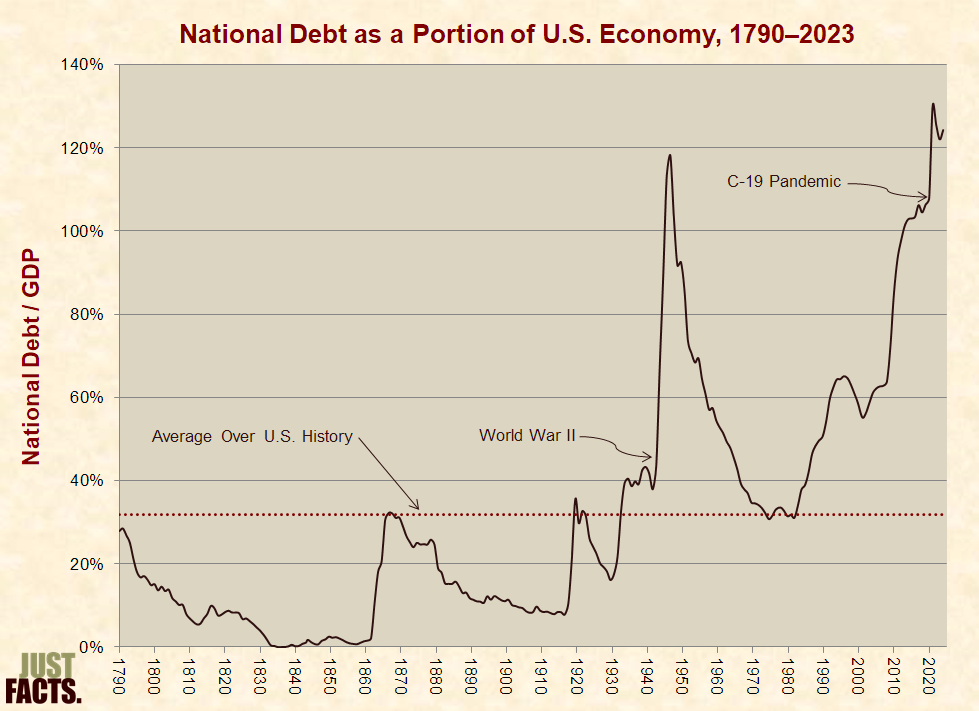
The National Debt... How much do you know?
 |
| Above Interpretation by Storm'n Norm'n |
The following from: Just Facts
National Debt
What You’ll Find
Comprehensive and meticulously documented facts about the national debt. Learn about various measures of the national debt, contributing factors, consequences, and more. For example:

X
APA
Agresti, J. D. (2016, November 22). National Debt Facts. Just Facts. Retrieved November 29, 2016 from www.justfacts.com/nationaldebt.asp
MLA
Agresti, James D. “National Debt Facts.” Just Facts. 22 November 2016. Web. 29 November 2016. <www.justfacts.com/nationaldebt.asp>.
Chicago (for footnotes)
James D. Agresti, “National Debt Facts,” Just Facts, last modified November 22, 2016, www.justfacts.com/nationaldebt.asp.
Chicago (for bibliographies)
Agresti, James. D. “National Debt Facts.” Just Facts. Last modified November 22, 2016. www.justfacts.com/nationaldebt.asp.


Quantifying the National Debt
* As of November 18, 2016, the official debt of the United States government is $19.9 trillion ($19,895,970,356,079).[1] This amounts to:

* Publicly traded companies are legally required to account for “explicit” and “implicit” future obligations such as employee pensions and retirement benefits.[7] [8] [9] The federal budget, which is the “government’s primary financial planning and control tool,” is not bound by this rule.[10] [11]
* At the close of the federal government’s 2015 fiscal year (September 30, 2015), the federal government had roughly:
* The figures above are determined in a manner that approximates how publicly traded companies are required to calculate their liabilities and obligations.[17] [18] [19] The obligations for Social Security and Medicare represent how much money must be immediately placed in interest-bearing investments to cover the projected shortfalls between dedicated revenues and expenditures for all current participants in these programs (both taxpayers and beneficiaries).[20] [21] [22]
* Combining the figures above with the national debt and subtracting the value of federal assets, the federal government had about $76.4 trillion ($76,438,000,000,000) in debts, liabilities, and unfunded obligations at the close of its 2015 fiscal year.[23]
* This $76.4 trillion shortfall is 90% of the combined net worth of all U.S. households and nonprofit organizations, including all assets in savings, real estate, corporate stocks, private businesses, and consumer durable goods such as automobiles and furniture.[24] [25]
* This shortfall equates to:
* These figures do not account for the future costs implied by any current policies except those of the Social Security and Medicare programs.[30]
* These figures are based upon current federal law and “a wide range of complex assumptions” made by federal agencies.[31] Regarding this:
- $61,250 for every person living in the U.S.[2]
- $158,132 for every household in the U.S.[3]
- 107% of the U.S. gross domestic product.[4]
- 569% of annual federal revenues.[5]
- $8.3 trillion ($8,279,000,000,000) in liabilities that are not accounted for in the publicly held national debt, such as federal employee retirement benefits, accounts payable, and environmental/disposal liabilities.[12]
- $26.7 trillion ($26,661,000,000,000) in obligations for current Social Security participants above and beyond projected revenues from their payroll and benefit taxes, certain transfers from the general fund of the U.S. Treasury, and assets of the Social Security trust fund.[13] [14]
- $28.5 trillion ($28,500,000,000,000) in obligations for current Medicare participants above and beyond projected revenues from their payroll taxes, benefit taxes, premium payments, and assets of the Medicare trust fund.[15] [16]
- $237,284 for every person living in the U.S.[26]
- $613,531 for every household in the U.S.[27]
- 423% of the U.S. gross domestic product.[28]
- 2,192% of annual federal revenues.[29]
- The Board of Social Security Trustees has stated that “significant uncertainty” surrounds the “best estimates” of future circumstances.”[32]
- The Board of Medicare Trustees has stated that the program’s financial projections “are highly uncertain, especially when looking out more than several decades.”
- The Board of Medicare Trustees has stated that the program’s long-term costs may be “substantially higher” than projected under current law. This is because current law includes the effects of the Affordable Care Act, which will cut Medicare prices for “many” healthcare services to “less than half of their level” under prior law. Per the Trustees:
Absent an unprecedented change in health care delivery systems and payment mechanisms, the prices paid by Medicare for health services will fall increasingly short of the costs of providing these services. … Before such an outcome would occur, lawmakers would likely intervene to prevent the withdrawal of providers from the Medicare market and the severe problems with beneficiary access to care that would result.[33]
Causes of the National Debt
Spending and Taxes
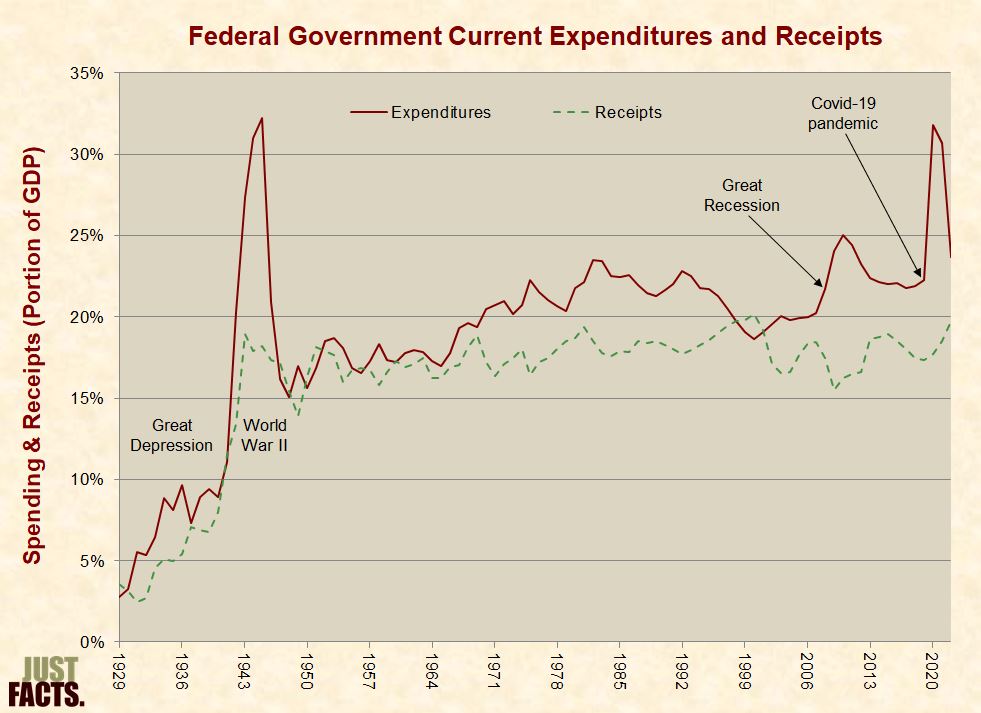 |
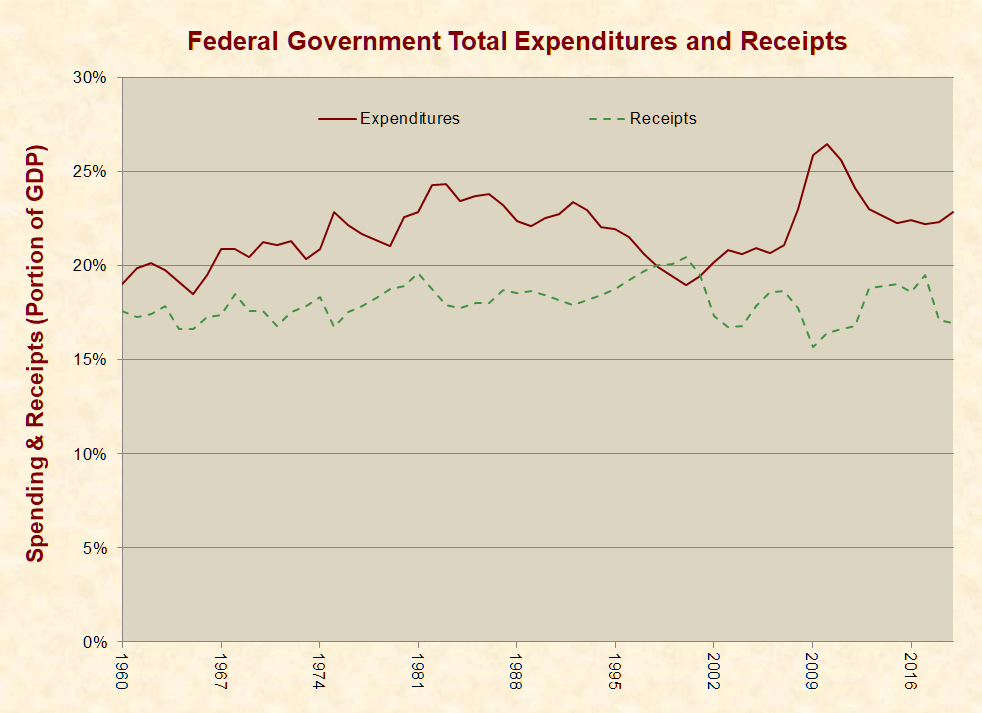
† To measure the entirety of government expenditures and receipts, “total” instead of “current” figures are preferable, but such data (shown in the next graph) only extends back to 1960.[34]
‡ In 2015, receipts consisted of: 97% taxes; 2% premiums, settlements, donations, fines, fees, & penalties; 1% interest & dividends.[35] |
Year
|
Receipts
(Portion of GDP) |
Expenditures
(Portion of GDP) |
1930
|
3%
|
3%
|
1940
|
8%
|
9%
|
1950
|
16%
|
16%
|
1960
|
17%
|
17%
|
1970
|
17%
|
20%
|
1980
|
19%
|
22%
|
1990
|
18%
|
22%
|
2000
|
20%
|
19%
|
2010
|
16%
|
25%
|
2015
|
19%
|
22%
|
Year
|
Receipts
(Portion of GDP) |
Expenditures
(Portion of GDP) |
1960
|
18%
|
19%
|
1970
|
18%
|
21%
|
1980
|
19%
|
23%
|
1990
|
18%
|
22%
|
2000
|
20%
|
19%
|
2010
|
16%
|
27%
|
2015
|
19%
|
22%
|
Spending Distribution
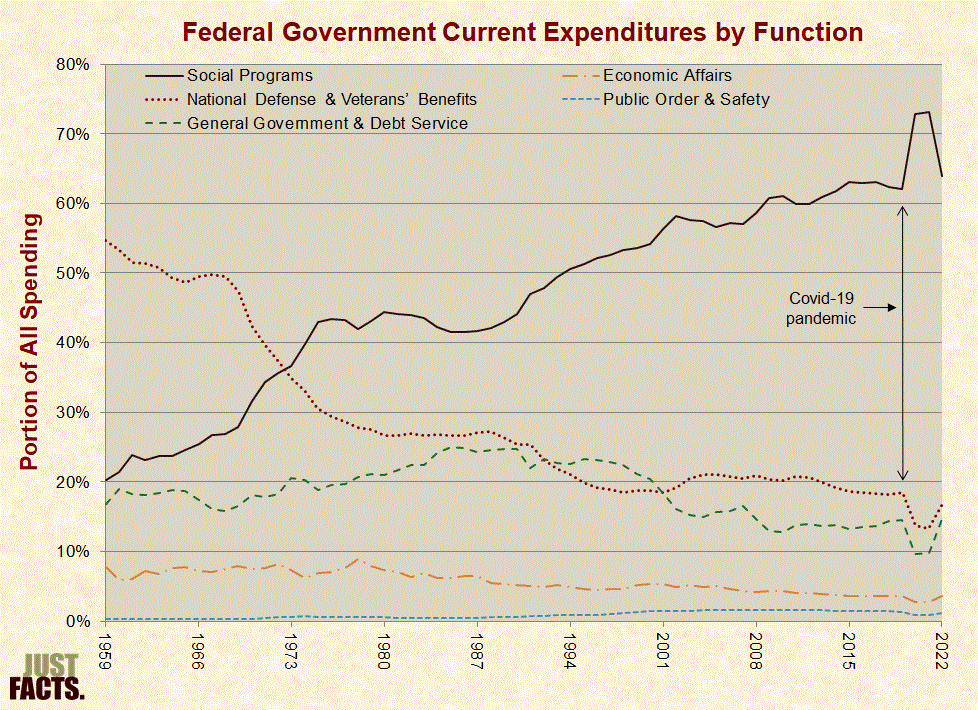 |
† Social programs include income security, healthcare, education, housing, and recreation.
‡ National defense includes military spending and veterans’ benefits. § General government and debt service includes the executive & legislative branches, tax collection, financial management, and interest payments. # Economic affairs includes transportation, general economic & labor affairs, agriculture, natural resources, energy, and space. (This excludes spending for infrastructure projects such as new highways, which is not accounted for in this graph.[38]) £ Public order and safety includes police, fire, law courts, prisons, and immigration enforcement. |
Category
|
Portion of Total Federal Spending
| ||||||
1960
|
1970
|
1980
|
1990
|
2000
|
2010
|
2015
| |
| Social Programs |
21%
|
32%
|
45%
|
44%
|
54%
|
61%
|
63%
|
| National Defense |
53%
|
42%
|
26%
|
25%
|
19%
|
20%
|
19%
|
| General Government & Debt Service |
19%
|
18%
|
21%
|
25%
|
21%
|
13%
|
13%
|
| Economic Affairs & Infrastructure |
6%
|
7%
|
7%
|
5%
|
5%
|
4%
|
4%
|
| Public Order & Safety |
0%
|
0%
|
1%
|
1%
|
1%
|
1%
|
1%
|
Tax Distribution
 |
NOTE: This data does not account for 7% of federal revenues that could not be allocated to households by income group.
|
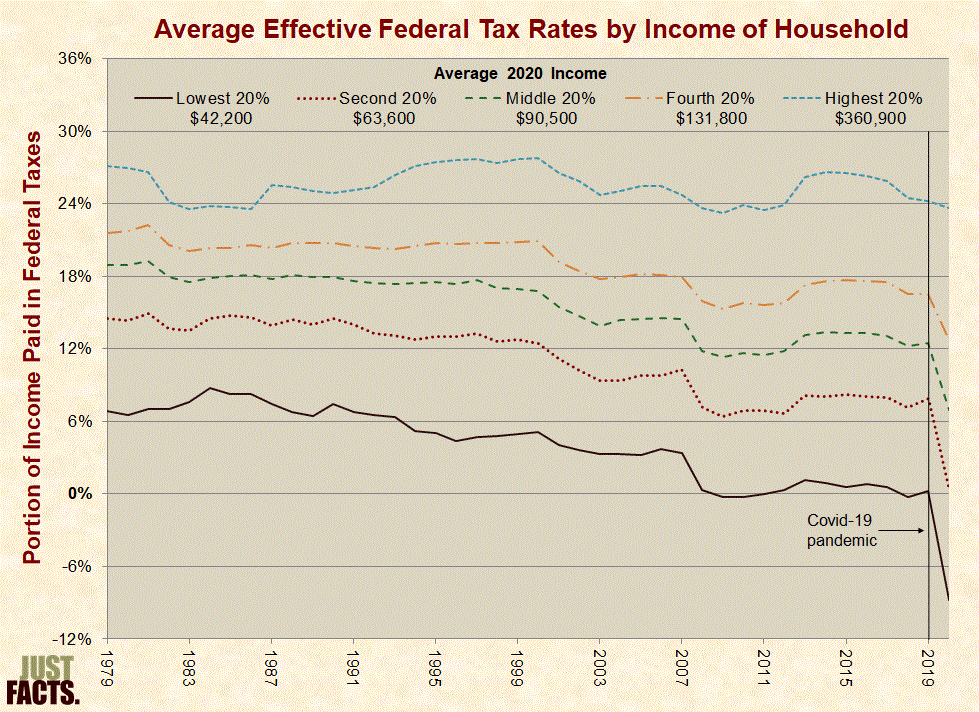
Average Effective Federal Tax Burdens (2013)
| |||
Income Group
|
Household Income
|
Tax Rate
|
Taxes Paid
|
| Lowest 20% |
$25,400
|
3.3%
|
$838
|
| Second 20% |
$47,400
|
8.4%
|
$3,982
|
| Middle 20% |
$69,700
|
12.8%
|
$8,922
|
| Fourth 20% |
$103,700
|
17.0%
|
$17,629
|
| Highest 20% |
$265,000
|
26.3%
|
$69,695
|
Income Group
|
Household Income
|
Tax Rate
|
Taxes Paid
|
| 81st - 90th |
$147,100
|
20.7%
|
$30,450
|
| 91st - 95th |
$201,400
|
23.0%
|
$46,322
|
| 96th - 99th |
$326,800
|
26.3%
|
$85,948
|
| Top 1 % |
$1,571,600
|
34.0%
|
$534,344
|
Politics
Responsibility
- passed by majorities in both houses of Congress and approved by the President; or
- passed by majorities in both houses of Congress, vetoed by the President, and then passed by two-thirds of both houses of Congress; or
- passed by majorities in both houses of Congress and left unaddressed by the President for ten days.[56]
Current Policies
- Unemployment will incrementally decline from 6.8% in 2014 to 5.8% in 2018 and 5.3% in 2027, where it will remain thereafter.[60] (For reference, the average of the previous 40 years is 6.5%.[61])
- GDP growth will incrementally decline from an average rate of 3.4% above the rate of inflation in 2015 to 1.9% in 2021 and remain constant thereafter.[62] (The average of the previous 40 years is 2.9%.[63])
- Federal revenues (i.e., taxes) will incrementally increase from 17.4% of GDP in 2014 to 18.0% in 2024 and remain constant thereafter.[64] (The average of the previous 40 years is 17.4%.[65])
- Federal spending will incrementally increase from 20.4% of GDP in 2014 to 23.6% in 2025 and 31.8% in 2040.[66] (The average of the previous 40 years is 20.5%.[67])
- Payments for Medicare services will undergo scheduled reductions that would likely cause “severe problems with beneficiary access to care.”[68] [69]
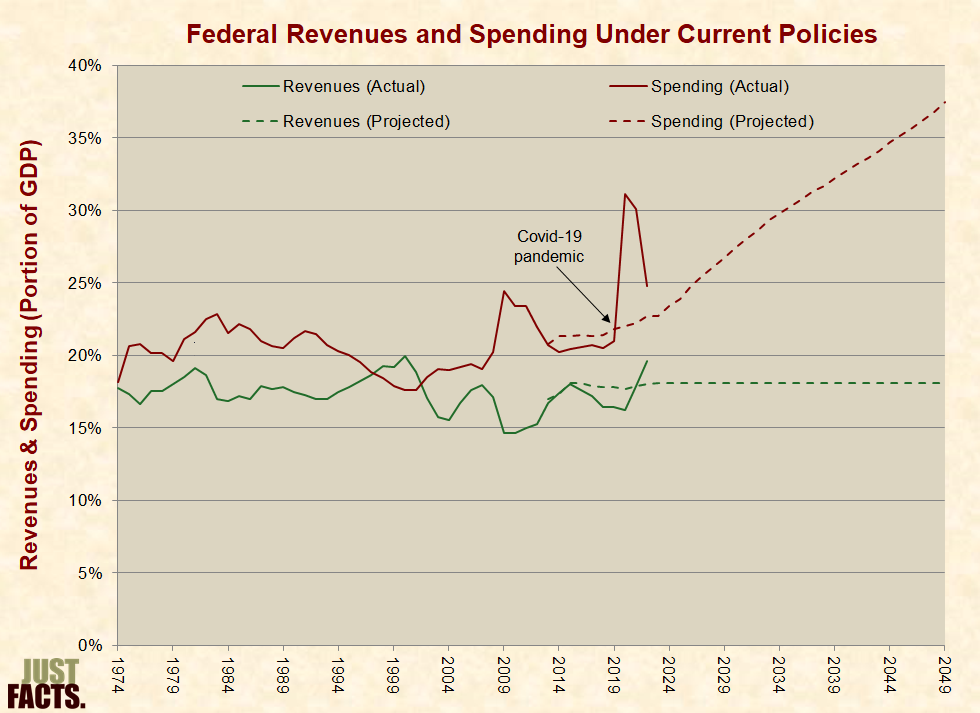
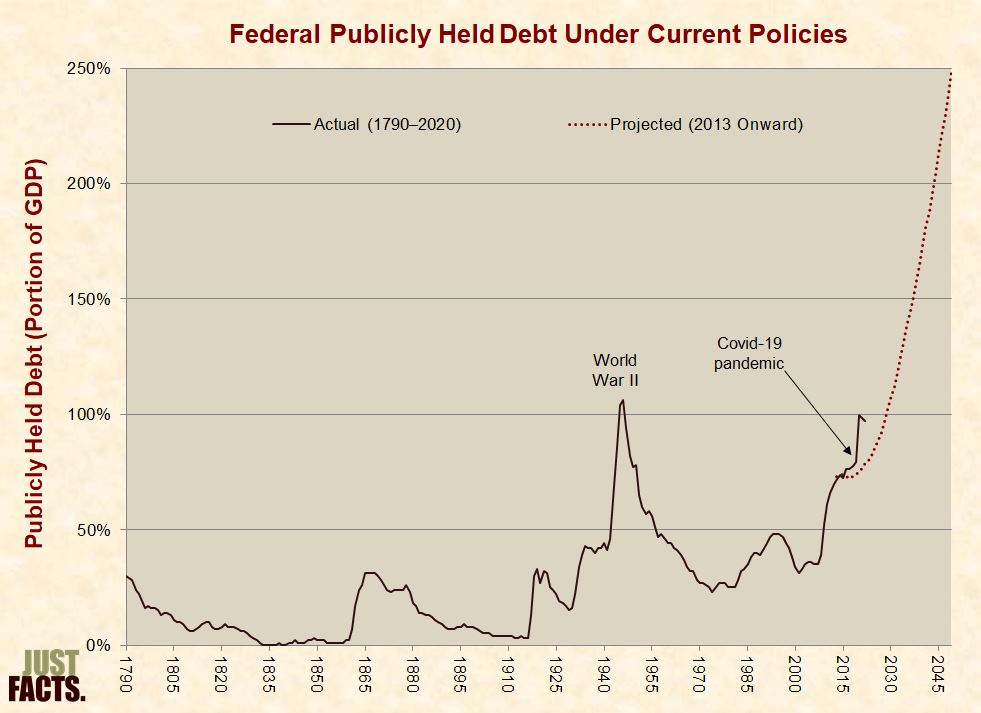
† To measure the entirety of the national debt, it would be preferable to show “gross” debt instead of “publicly held” debt, but this data is not presented in this report. Nonetheless, it would make little difference because the excluded debt primarily resides in federal government trust funds that dwindle and become insolvent during the projection period.[71] Facts regarding why and how the federal government keeps its books in this manner are covered in the section of this research entitled “Government Accounting.”
|
- punish younger generations of Americans, because most of the burden would fall on them.
- reward older generations of Americans, because “they would partly or entirely avoid the policy changes needed to stabilize the debt.”
- “substantially increase the size of the policy adjustments needed to put the budget on a sustainable course.”[73] [74]
- Paul Davidson, editor of the Journal of Post Keynesian Economics and author of The Keynes Solution: The Path to Global Economic Prosperity:[75]
Rather than bankrupting the nation, this large growth in the national debt [during World War II] promoted a prosperous economy. By 1946, the average American household was living much better economically than in the prewar days. Moreover, the children of that Depression–World War II generation were not burdened by having to pay off what then was considered a huge national debt. Instead, for the next quarter century, the economy continued on a path of unprecedented economic growth and prosperity….[76]
- Douglas J. Amy, professor of politics at Mount Holyoke College:[77]
Conservatives are also wrong when they argue that deficit spending and a large national debt will inevitably undermine economic growth. To see why, we need to simply look back at times when we have run up large deficits and increased the national debt. The best example is World War II when the national debt soared to 120% of GDP—nearly twice the size of today’s debt. This spending not only got us out of the Great Depression but set the stage for a prolonged period of sustained economic growth in the 50s and 60s.[78]
- Paul Krugman, Nobel Prize-winning economist and Princeton University professor:[79]
Right now, federal debt is about 50% of GDP. So even if we do run these deficits, federal debt as a share of GDP will be substantially less than it was at the end of World War II.
Again, the debt outlook is bad. But we’re not looking at something inconceivable, impossible to deal with; we’re looking at debt levels that a number of advanced countries, the U.S. included, have had in the past, and dealt with.[80]
- federal spending as a percent of GDP averaged 42% lower than the last year of the war.[81]
- publicly held debt as a percent of GDP decreased by 72 percentage points.[82]
- federal spending as a percent of GDP will average over 78% higher than in the four decades that followed World War II.[83]
- publicly held debt as a percent of GDP will rise by 277 percentage points.[84]
Alternative Policies
- Federal revenues will incrementally increase from 17.6% of GDP in 2014 to 18.0% in 2020, 19.9% in 2044, and 23.5% in 2084.[86] [87] At this point, federal revenues (i.e., taxes) will be 35% higher than the average of the previous 40 years.[88]
- Federal spending on all government functions will incrementally increase from 20.4% of GDP in 2014 to 21.5% in 2020, and 26.0% in 2040.[89] At this point, spending will be 27% higher than the average of the previous 40 years.[90]
- Payments for Medicare services will undergo reductions that will likely cause “severe problems with beneficiary access to care.”[91] [92]
- Starting in 2024, Medicare beneficiaries will have a choice to enroll in private plans paid for by Medicare or remain in the traditional Medicare program.[94] Also starting in 2024, the eligibility age for Medicare benefits will incrementally rise to correspond with Social Security’s retirement age.[95] Compared to the projections under the current policy scenario, Medicare spending will be 0.5% lower in 2016, 2% lower in 2020, and 4% lower in 2024.[96]
- Federal Medicaid spending will be converted to an “allotment that each state could tailor to meet its needs, indexed for inflation and population growth.”[97] The expansion of Medicaid manadated by the Affordable Care Act (a.k.a. Obamacare) will be repealed.[98] Compared to the projections under the current policy scenario, Medicaid spending will be 9% lower in 2016, 19% lower in 2020, and 24% lower in 2024.[99]
- All federal spending related to Obamacare’s exchange subsidies will be repealed.[100]
- Spending on all government functions except for interest payments on the national debt will incrementally decline from 18.9% of GDP in 2015 to 16% in 2025 before increasing to 16.4% in 2035.[101] (The average of the previous 40 years is 18.3%).[102]
- Revenues will increase from 18.2% of GDP in 2015 to 18.4% in 2025, 19% in 2032 and stay constant thereafter.[103] (The average of the previous 40 years is 17.4%.[104])

Public Opinion
- 80% of Americans are concerned “a great deal” or “quite a bit” about federal budget deficits and the national debt.
- if the deficit cannot be eliminated by cutting wasteful spending, 35% of Americans prefer to cut important programs while 33% prefer to raise taxes.
- 22% think cuts in Social Security spending will be needed to “significantly reduce the federal budget deficit,” 49% do not, and 29% have no opinion or are not sure.
- 18% think cuts in Medicare spending will be needed to “significantly reduce the federal budget deficit,” 54% do not, and 28% have no opinion or are not sure.[107]
- 85% of Americans are worried that the national debt “will harm future generations.”
- 56% think “the shortfalls will spark a major economic crisis in the coming decade.”
- when asked to choose between two options to balance the budget, 59% prefer to cut unspecified government services, while 30% prefer to raise unspecified taxes.[109]
- 70% of Americans were worried about the size of the federal deficit.
- 35% were willing to cut government spending.
- 18% were willing to raise taxes.
- 1% were willing to cut government spending and raise taxes.[110]
Congresses
Costs/Savings of Bills Sponsored or Cosponsored
in 2013 by Typical Congressman (in Billions)
| |||
Increases
|
Decreases
|
Net Agenda
| |
| House Democrats |
$407
|
$10
|
$397
|
| Senate Democrats |
$22
|
$3
|
$18
|
| House Republicans |
$9
|
$91
|
-$83
|
| Senate Republicans |
$6
|
$165
|
-$159
|
Costs/Savings of Bills Sponsored or Cosponsored in the First
Sessions of Congress by Typical Congressman (in Billions)
| |||||||
2011
|
2009
|
2007
|
2005
|
2003
|
2001
|
1999
| |
| House Democrats |
$497
|
$500
|
$547
|
$547
|
$402
|
$262
|
$34
|
| Senate Democrats |
$24
|
$134
|
$59
|
$52
|
$174
|
$88
|
$15
|
| House Republicans |
-$130
|
-$45
|
$7
|
$12
|
$31
|
$20
|
-$5
|
| Senate Republicans |
-$239
|
$51
|
$7
|
$11
|
$26
|
$19
|
-$324
|
| NOTE: Data not adjusted for inflation. | |||||||
Presidents
Many of you have talked about the need to pay down our national debt. I listened, and I agree. We owe it to our children and grandchildren to act now, and I hope you will join me to pay down $2 trillion in debt during the next 10 years. At the end of those 10 years, we will have paid down all the debt that is available to retire. That is more debt, repaid more quickly than has ever been repaid by any nation at any time in history.[115]
I refuse to leave our children with a debt that they cannot repay—and that means taking responsibility right now, in this administration, for getting our spending under control.[120]
Ownership
* As of September 30, 2016, the national debt consists of:
* Ownership of publicly held debt as of September 30, 2016:

* Data from the chart above:
* Per the White House Office of Management and Budget (2016):
* Ownership of U.S. government debt by foreign creditors as of August 31, 2016:

* Data from the chart above:
* Foreign purchases of U.S. government debt increase the demand for this debt, thus putting downward pressure on U.S. interest rates. Conversely, foreign sales of U.S. government debt place upward pressure on U.S. interest rates.[170] [171]
* Per a 2008 Congressional Research Service report, a “potentially serious short-term problem would emerge if China decided to suddenly” sell its holding of U.S. government debt. Possible effects could include:
* The same report states:
* During a visit to China in February 2009, Secretary of State Hillary Clinton said:
* In August 2007 during a currency dispute between the U.S. and China, two leading officials of Chinese Communist Party bodies suggested that China use the threat of selling U.S. debt as a “bargaining chip.”[175]
* In February 2009 during a dispute over U.S. arms sales to Taiwan, a Chinese general made the following statements in the state-run magazine Outlook Weekly:
* One month later while appearing before China’s parliament, the head of China’s State Administration of Foreign Exchange said:
* Ownership of intergovernmental debt as of September 30, 2016:

* Data from the chart above:
Amount
|
Owed To:
|
Portion of Total
|
| $14.2 trillion | owed to non-federal entities (i.e., publicly held debt) |
72%
|
| $5.4 trillion | owed to federal entities (i.e., intragovernmental debt) |
28%
|
Debt Owed to Non-Federal Entities

Entities
|
Amount (billions)
|
Portion of Total
|
| Foreign & International |
$6,148
|
45%
|
| Federal Reserve[166] |
$2,462
|
18%
|
| Other Investors |
$1,343
|
10%
|
| Mutual Funds |
$1,315
|
10%
|
| State & Local Governments |
$687
|
5%
|
| Banks & Savings Institutions |
$547
|
4%
|
| Private Pension Funds |
$540
|
4%
|
| Insurance Companies |
$297
|
2%
|
| U.S. Savings Bonds |
$172
|
1%
|
| State and Local Government Pension Funds |
$164
|
1%
|
Debt Owed to Foreign Entities
During most of American history, the Federal debt was held almost entirely by individuals and institutions within the United States. In the late 1960s, foreign holdings were just over $10 billion, less than 5 percent of the total Federal debt held by the public. Foreign holdings began to grow significantly starting in the 1970s and now represent almost half of outstanding [publicly held] debt.[168]
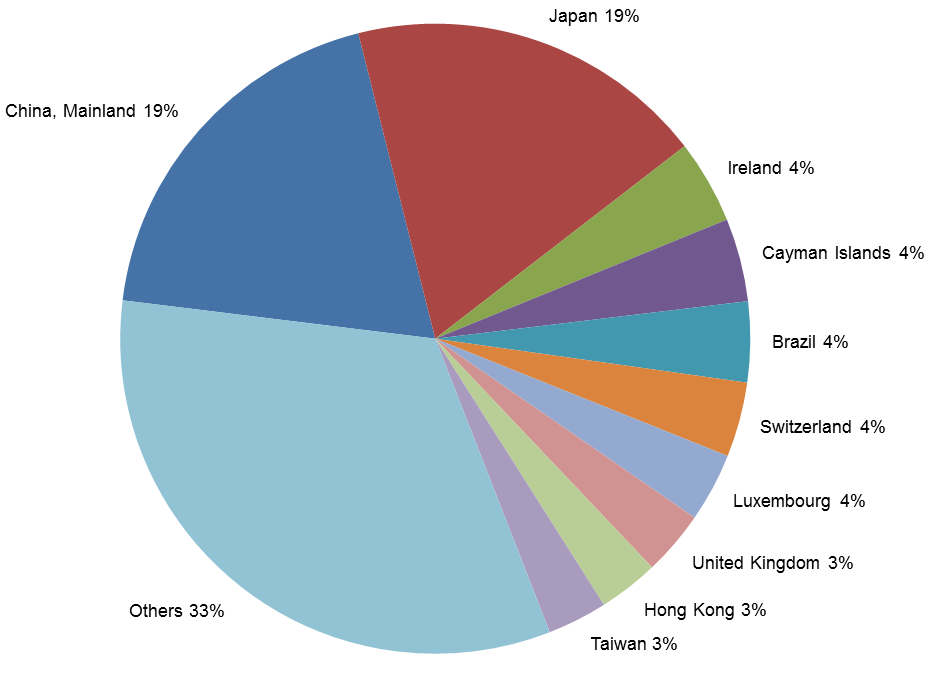
Country
|
Amount (billions)
|
Portion of Total
|
| China, Mainland |
$1,185
|
19%
|
| Japan |
$1,144
|
18%
|
| Ireland |
$266
|
4%
|
| Cayman Islands |
$264
|
4%
|
| Brazil |
$256
|
4%
|
| Switzerland |
$238
|
4%
|
| Luxembourg |
$220
|
4%
|
| United Kingdom |
$205
|
3%
|
| Hong Kong |
$192
|
3%
|
| Taiwan |
$190
|
3%
|
| Others |
$2,037
|
33%
|
| Total |
$6,196
|
100%
|
- “a more general financial reaction (or panic), in which all foreigners responded by reducing their holdings of U.S. assets”;
- “a sudden and large depreciation in the value of the dollar”;
- “a sudden and large increase in U.S. interest rates”;
- a stock market fall; and/or
- “a recession.”[172]
The likelihood that China would suddenly reduce its holdings of U.S. securities is questionable because it is unlikely that doing so would be in China’s economic interests. First, a large sell-off of China’s U.S. holdings could diminish the value of these securities in international markets…. Second, such a move would diminish U.S. demand for Chinese imports…. A sharp reduction of U.S. imports from China could have a significant impact on China’s economy….[173]
By continuing to support American Treasury instruments [i.e., buy U.S. government debt] the Chinese are recognizing our interconnection. … We have to incur more debt. It would not be in China’s interest if we were unable to get our economy moving again. … The U.S. needs the investment in Treasury bonds to shore up its economy to continue to buy Chinese products.[174]
Our retaliation should not be restricted to merely military matters, and we should adopt a strategic package of counterpunches covering politics, military affairs, diplomacy and economics to treat both the symptoms and root cause of this disease. … [W]e could sanction them using economic means, such as dumping some U.S. government bonds.[176]
the U.S. Treasury market is important to us. … This is purely market-driven investment behavior. I would hope not to see this matter politicized.[177]
Debt Owed to Federal Entities
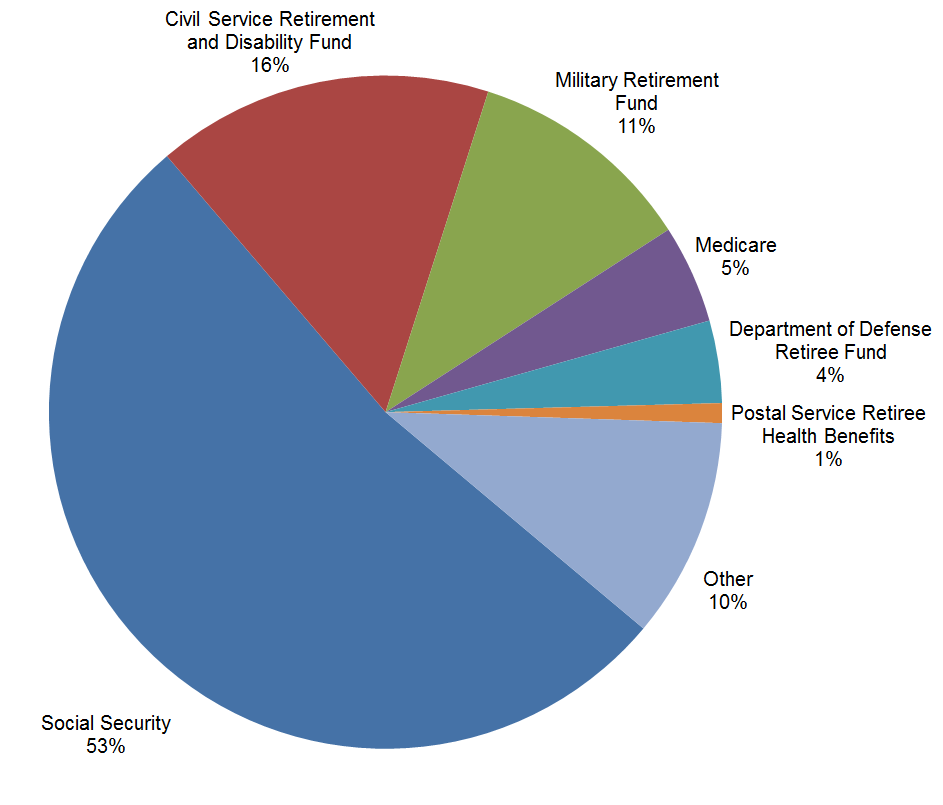
Funds
|
Amount (billions)
|
Portion of Total
|
| Social Security |
$2,843
|
53%
|
| Civil Service Retirement and Disability |
$874
|
16%
|
| Military Retirement |
$591
|
11%
|
| Medicare |
$256
|
5%
|
| Department of Defense Retiree Healthcare |
$213
|
4%
|
| Postal Service Retiree Health Benefits |
$51
|
1%
|
| Other |
$572
|
11%
|
Media
Budget Cuts
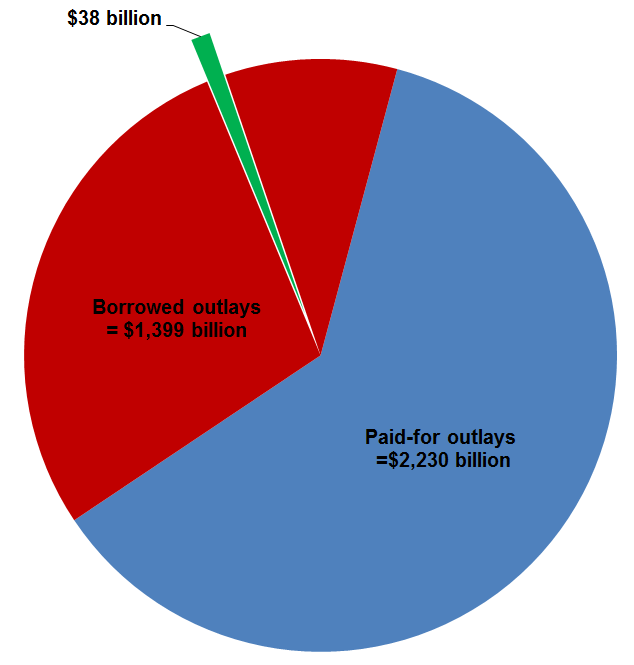
- “New Cuts Detailed in Agreement for $38 Billion in Reductions”; “deep budget cuts in programs for the poor, law enforcement, the environment and civic projects” - Los Angeles Times[179]
- “Congress Sends Budget Cut Bill to Obama”; “cutting a record $38 billion from domestic spending” - Associated Press[180]
- “Budget Deal to Cut $38 Billion Averts Shutdown”; “Republicans were able to force significant spending concessions from Democrats….” – New York Times[181]

Tax Cuts
Now, please understand that the Bush tax cuts are the single largest part of the black hole that is the federal budget deficit.[186]
The “Do Nothing” Plan
shows what happens if we do … nothing. The answer, as you can see, is that the budget comes roughly into balance.[196]
a balanced mix of revenues, through returning tax rates to Clinton-era levels and implementing the taxes in the Affordable Care Act, and program cuts … in Medicare….[199]
- Certain elements of the tax code are not indexed for inflation or wage growth. Consequently, taxpayers are shifted over time into higher tax brackets.
- According to the Congressional Budget Office, by 2020 revenues “reach higher levels relative to the size of the economy than ever recorded in the nation’s history.”
- Revenues as a portion of GDP continue climbing through 2084, rising 69% higher than the average of the past 40 years and 47% higher than ever recorded in the history of the United States.[200] [201]
- As a portion of GDP, federal spending without interest on the national debt rises by 2084 to 68% higher than the average of the past 40 years.[202]
Context
Political Power
|
Dates
|
Average Annual Change in National Debt
(Percentage Points of GDP)
|
| Bill Clinton with Democratic House and Senate | 1/20/93 – 1/4/95 |
0.9
|
| Bill Clinton with Republican House and Senate | 1/4/95 – 1/19/01 |
-1.6
|
| George W. Bush with Republican House and Senate | 1/19/01 – 6/6/01, 11/12/02 – 1/4/07 |
0.8
|
| George W. Bush with Republican House and Democratic Senate | 6/6/01 – 11/12/02 |
2.3
|
| George W. Bush with Democratic House and Senate | 1/4/07 – 1/20/09 |
6.5
|
| Barack Obama with Democratic House and Senate | 1/20/09 – 1/4/11 |
9.3
|
| Barack Obama with Republican House and Democratic Senate | 1/5/11 – 1/6/15 |
1.9
|
Subscribe to:
Posts (Atom)